Complete Pandas Tutorial from Start to End - Chapter Final


Welcome to the third and final chapter of the complete pandas tutorial from start to end. If you haven't read the initial articles, I would recommend you to read Chapter 1 and Chapter 2.
Contents of Pandas Tutorial Chapter Final:
- Aggregating data
- Grouping data
- Joining different files
- Writing data to Files
- Becoming Pandas Master from here.
This final chapter of our Pandas Tutorial is highly important, Let's take a deep breath and start.
Aggregating Data
If you want to aggregate the data using one or more data over a specified axis, Pandas have an agg() method for that. Let's understand using the example of the iris dataset.
Suppose we have a requirement to aggregate the data on the basis of sum, minimum value, or maximum value of data columns. The below code of agg() will help to achieve that.
    import pandas as pd

    column_names = ["sepal length","sepal width","petal length","petal width","Type of flower"]
    df = pd.read_csv("https://archive.ics.uci.edu/ml/machine-learning-databases/iris/iris.data",
                     names=column_names)

    abc = df.agg(["mean","sum","std"])
    print(abc)
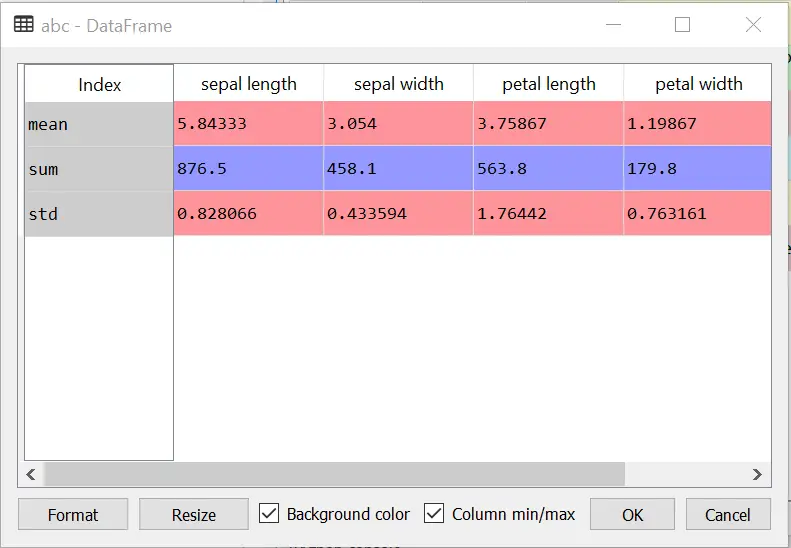
You must be wondering, what's the use of this function, why can't we use to describe a method for the count, min, max, etc. You are absolutely correct, you can use it. But in aggregation, there are tons of default methods that you can use. You can even create your custom aggregation function just like count, sum. Let's see an example.
Custom Aggregation Functions in Pandas
    import pandas as pd
    import numpy as np

    # Method for Ranking the Category
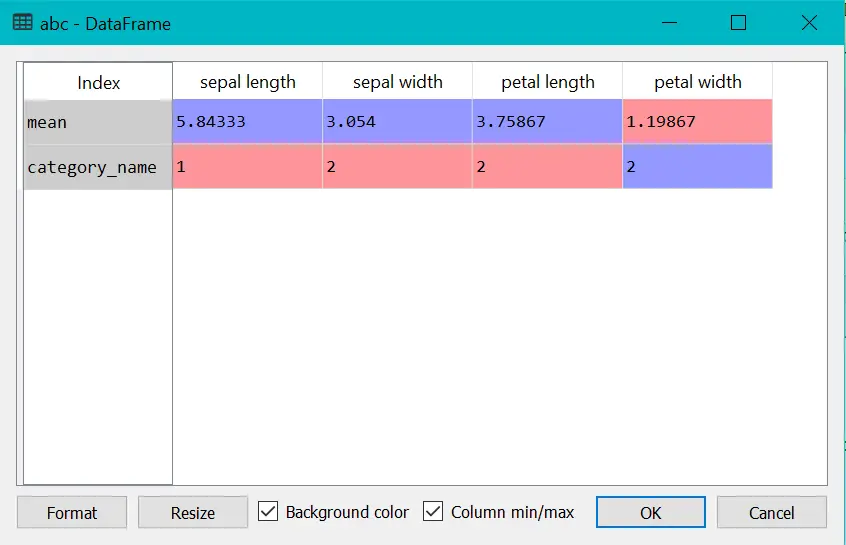
    # if the mean is less than 4 it will return 1 category else 2
    def category_name(arr):
        mean = arr.mean()
        if mean>4:
            return 1
        else:
            return 2

    column_names = ["sepal length","sepal width","petal length","petal width","Type of flower"]
    df = pd.read_csv("https://archive.ics.uci.edu/ml/machine-learning-databases/iris/iris.data",
                     names=column_names)
    #category_name is the custom aggregation function
    abc = df.agg(["mean",category_name])
    print(abc)
Grouping data
The group by operation involves splitting the data, applying a function, and combining the results.
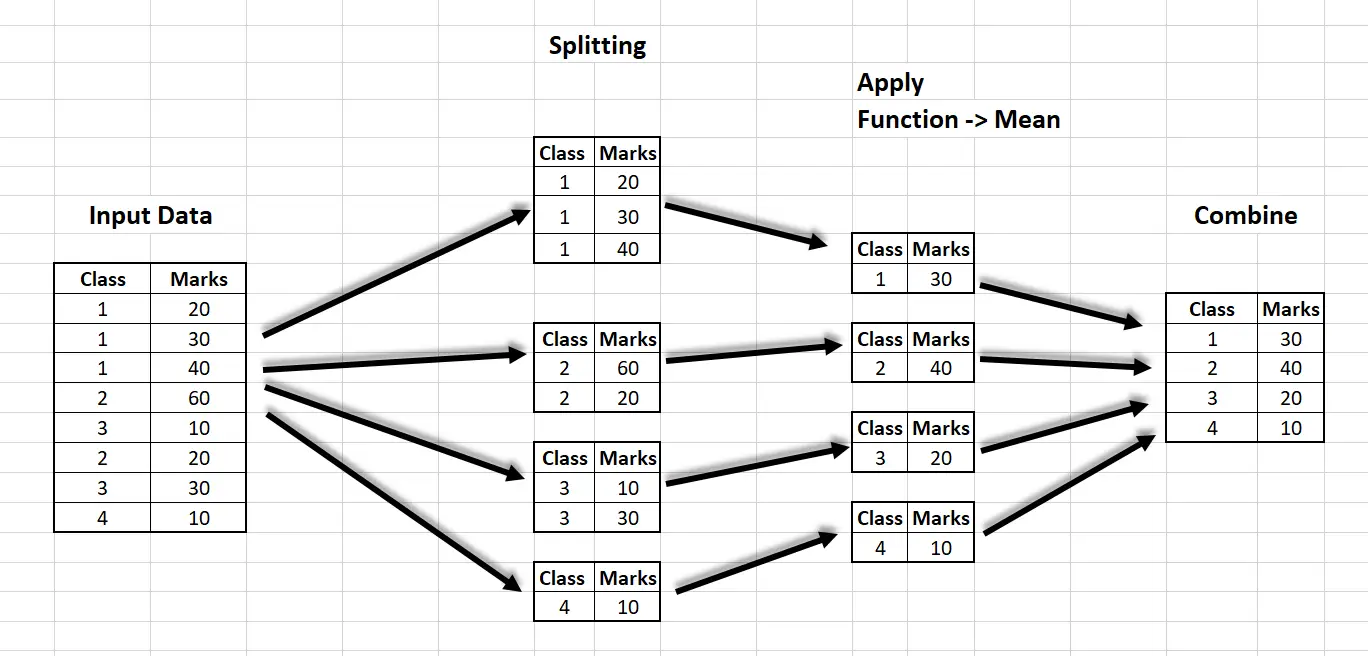
The above diagram shows the splitting of the input data in groups, then applying the function on each of the groups, then combining the results. There are classes from 1 to 4, having different marks. The splitting step involves splitting each class into four groups i.e. class 1, class 2, ... class 4. Then applying the function, in the example we applied the mean function. The final step involves combining the records.
Hands-on Example with iris dataset.
    import pandas as pd
    import numpy as np

    column_names = ["sepal length","sepal width","petal length","petal width","Type of flower"]
    df = pd.read_csv("https://archive.ics.uci.edu/ml/machine-learning-databases/iris/iris.data",
                     names=column_names)
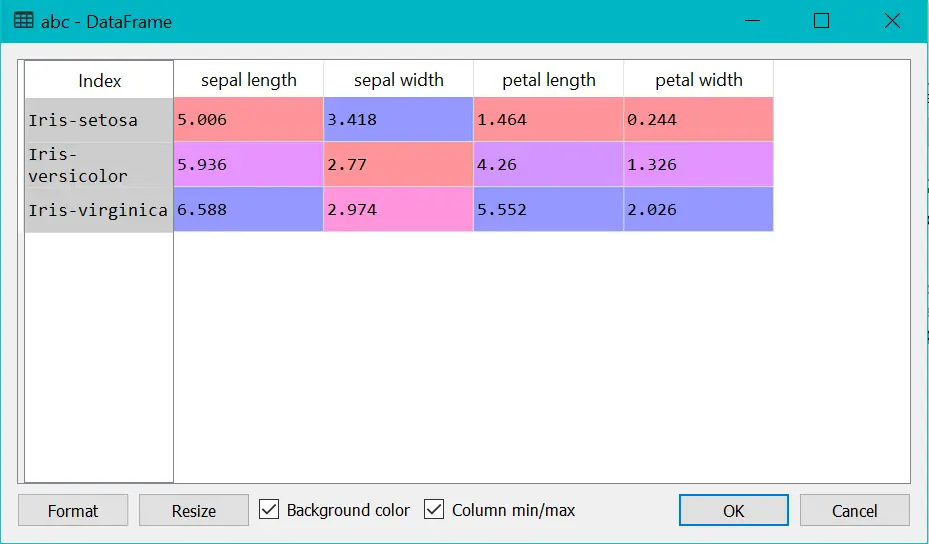
    #Check the mean sepal length, sepal width, petal length, petal width on the
    #basis of type of flower
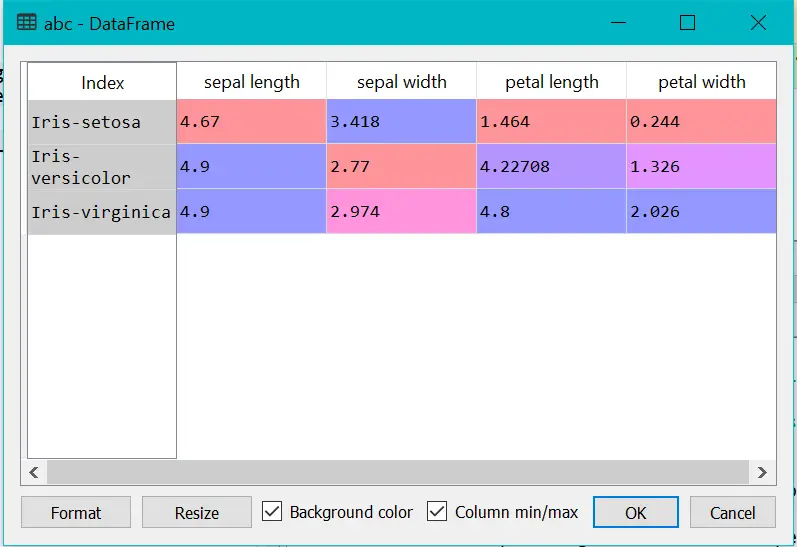
    abc = df.groupby('Type of flower').mean()
    print(abc)
Bonus: Using Custom Function in the group by
    import pandas as pd
    import numpy as np

    #Get the mean of the group less than 5
    def get_mean_group_lessthan_five(arr):
        return arr[(arr<5)].mean()

    column_names = ["sepal length","sepal width","petal length","petal width","Type of flower"]
    df = pd.read_csv("https://archive.ics.uci.edu/ml/machine-learning-databases/iris/iris.data",
                     names=column_names)
    abc = df.groupby('Type of flower').apply(get_mean_group_lessthan_five)
    print(abc)
Joining different files
In real-world problems, the data is rarely a single file. Generally, it is present in different files. We merge all files into a single unit based on our need, after that we continue our analysis.
In this section, we will learn how to join different files in pandas.
Before divings, let's see the different types of joins:
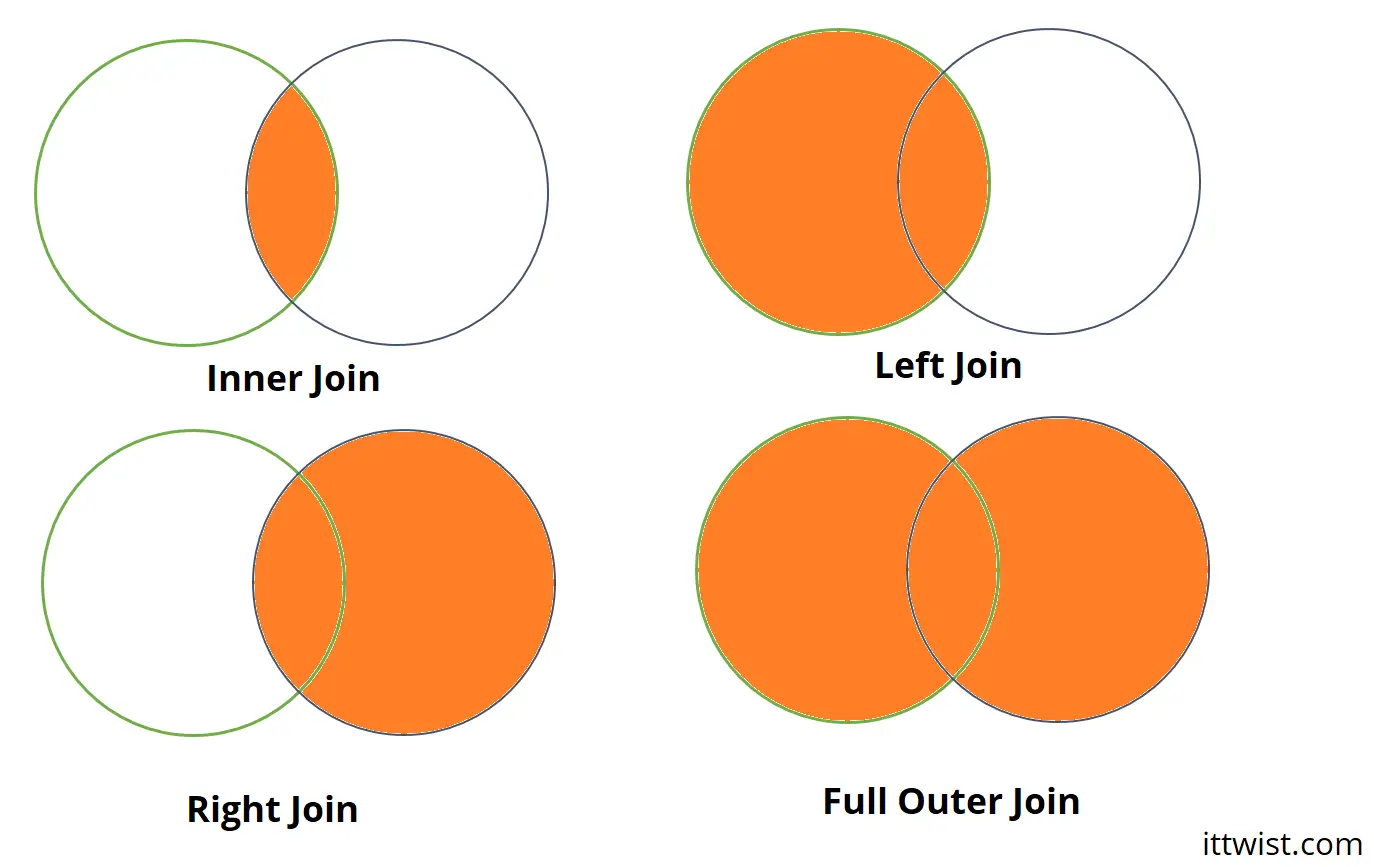
- Inner Join/Inner Merge: In the inner merge, we keep the rows which are common between the left dataframe and right data frame.
- Left Join/Left Merge: In this merge, we keep the rows of the left dataframe, where there are no matching records in the right dataframe they got replaced by NAN.
- Right Join/Right Merge: In this merge, we keep the rows of the right dataframe, where there are no matching records in the left dataframe they got replaced by NAN.
- Full Outer Join/Outer Merge: In this merge, we keep rows of both dataframes, where there are no matching records, they got replaced by NAN.
Syntax:
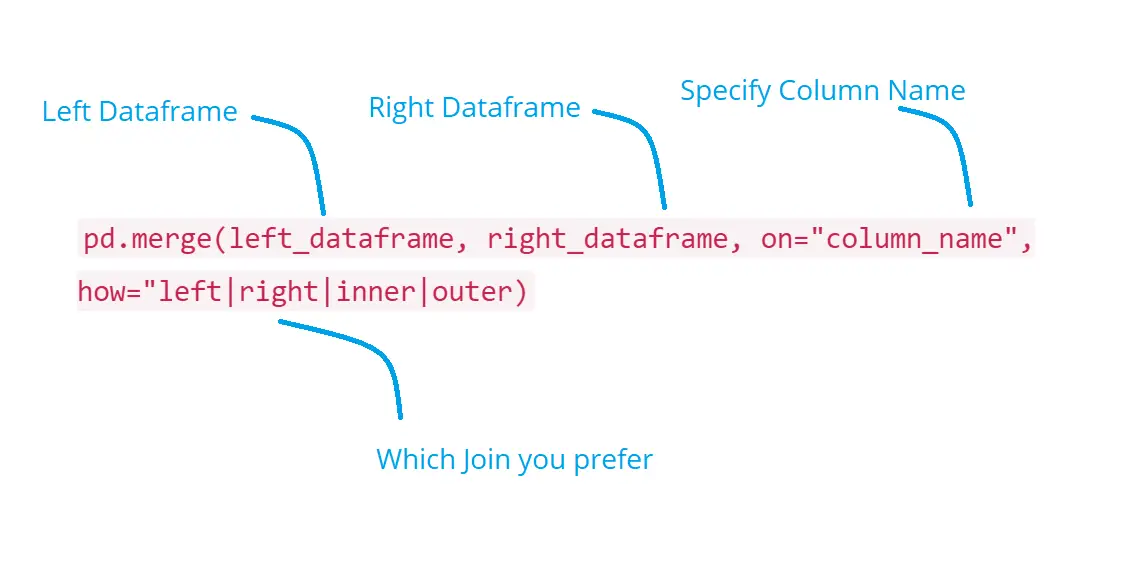
You need to mention:
- Left Dataframe
- Right Dataframe
- On -> The column which is common in both dataframe, sometimes the column names of left dataframe and right dataframe are different in that case use. left_on for the left dataframe column name and right_on for the right dataframe column name.
- how -> Specify which join.
Deep Diving to Joins:
Left Merge:
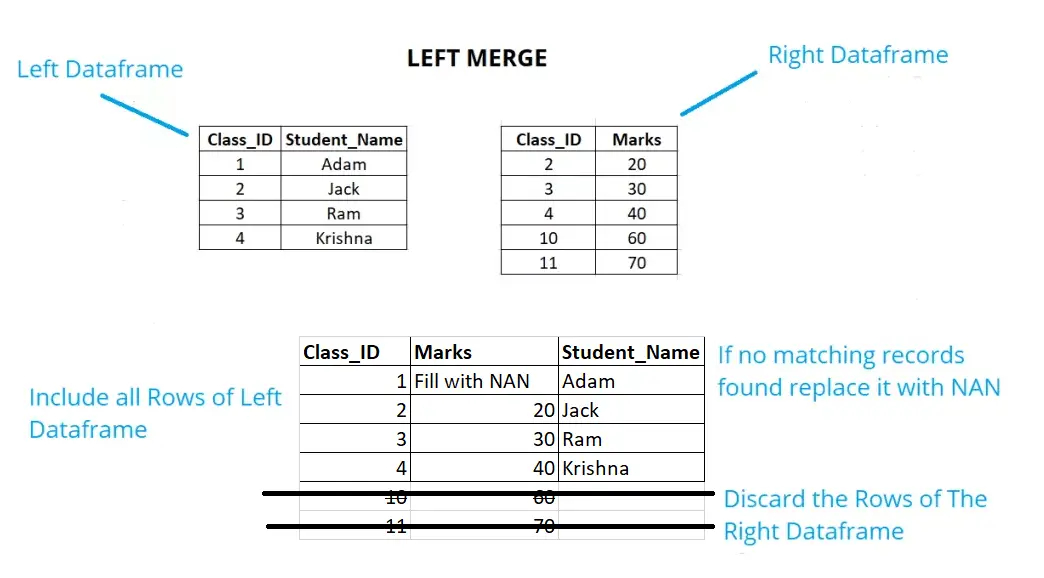
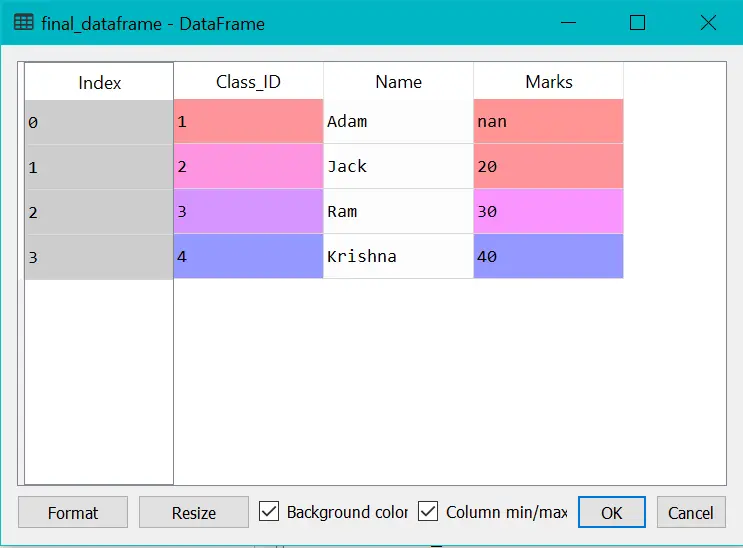
See the example below, if we have a left join, we will keep all the rows of the left data frame. If no respective records are found in the right data frame replace the same with NAN. Just like we have Class_ID as 1, there are no matching records in Right data frame hence it will be replaced with NAN. Also, we will discard the right non-matched records, like Class ID 10 and 11.
Example:
    import pandas as pd
    import numpy as np

    dataframe1 = pd.DataFrame({"Class_ID":[1,2,3,4],
                               "Name":["Adam","Jack","Ram","Krishna"]})

    dataframe2 = pd.DataFrame({"Class_ID":[2,3,4,10,11],
                               "Marks":[20,30,40,60,70]})


    final_dataframe = pd.merge(dataframe1,dataframe2,on="Class_ID",how="left")
    final_dataframe
Right Merge
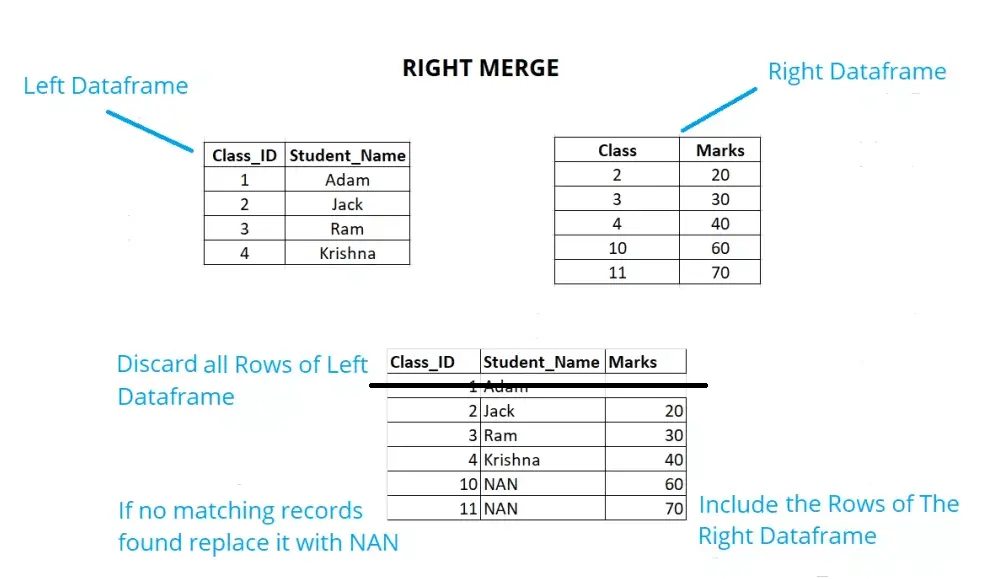
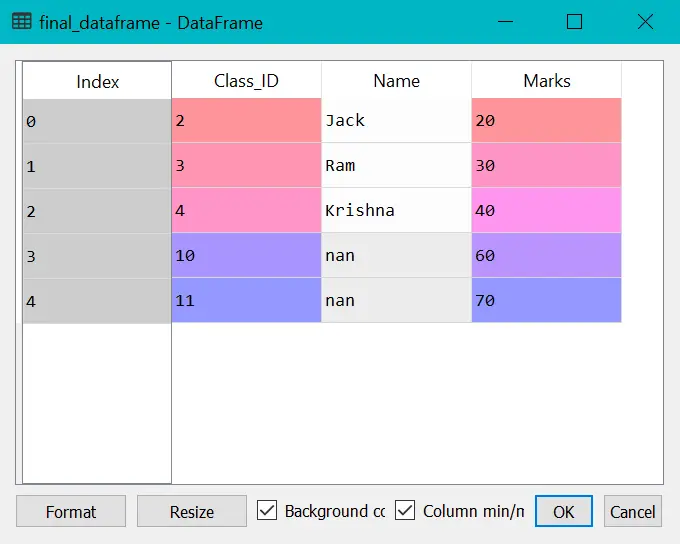
See the example below, if we have the right join, we will keep all the rows of the right data frame. If no respective records are found in the left data frame replace the same with NAN. Just like we have Class_ID as 10,11, there are no matching records in the left data frame hence it will be replaced with NAN. Also, we will discard the right non-matched records, like Class ID 1.
Example:
    import pandas as pd
    import numpy as np

    dataframe1 = pd.DataFrame({"Class_ID":[1,2,3,4],
                               "Name":["Adam","Jack","Ram","Krishna"]})

    dataframe2 = pd.DataFrame({"Class_ID":[2,3,4,10,11],
                               "Marks":[20,30,40,60,70]})


    final_dataframe = pd.merge(dataframe1,dataframe2,on="Class_ID",how="right")
    final_dataframe
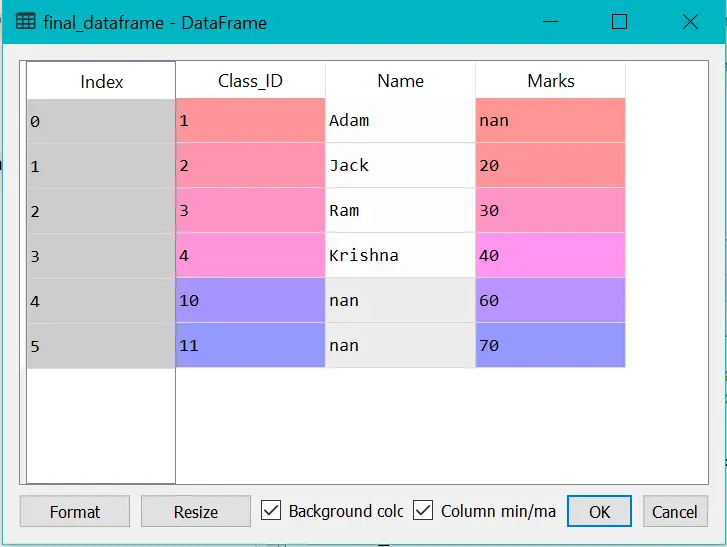
Outer Merge:
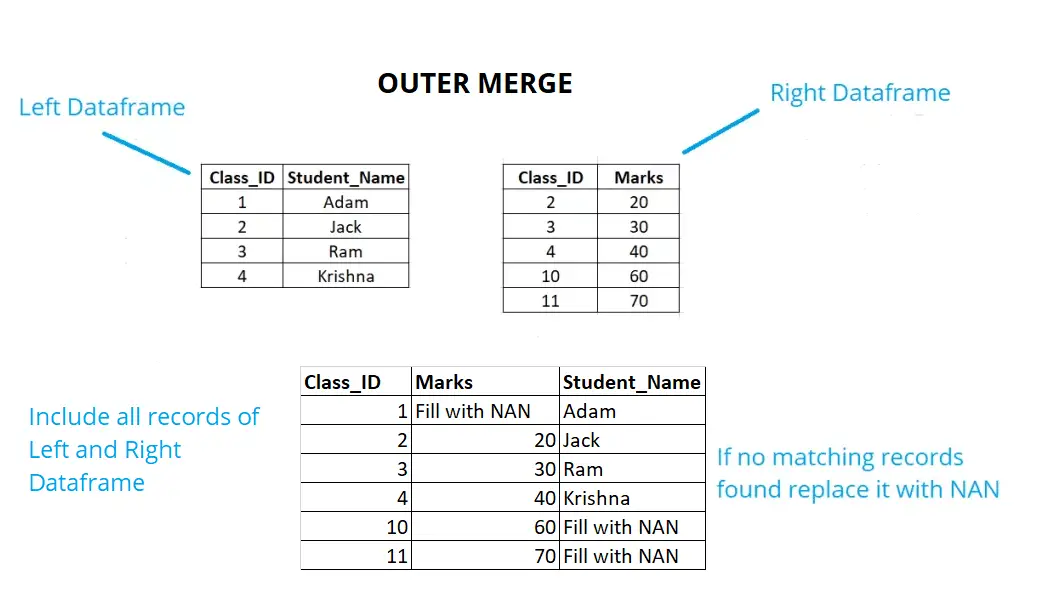
In the example below, if we have an outer join, we will keep all the rows of the right data frame and left data frame. If no respective records are found in any of the data frames replace the same with NAN.
Example:
    import pandas as pd
    import numpy as np

    dataframe1 = pd.DataFrame({"Class_ID":[1,2,3,4],
                               "Name":["Adam","Jack","Ram","Krishna"]})

    dataframe2 = pd.DataFrame({"Class_ID":[2,3,4,10,11],
                               "Marks":[20,30,40,60,70]})


    final_dataframe = pd.merge(dataframe1,dataframe2,on="Class_ID",how="outer")
    final_dataframe
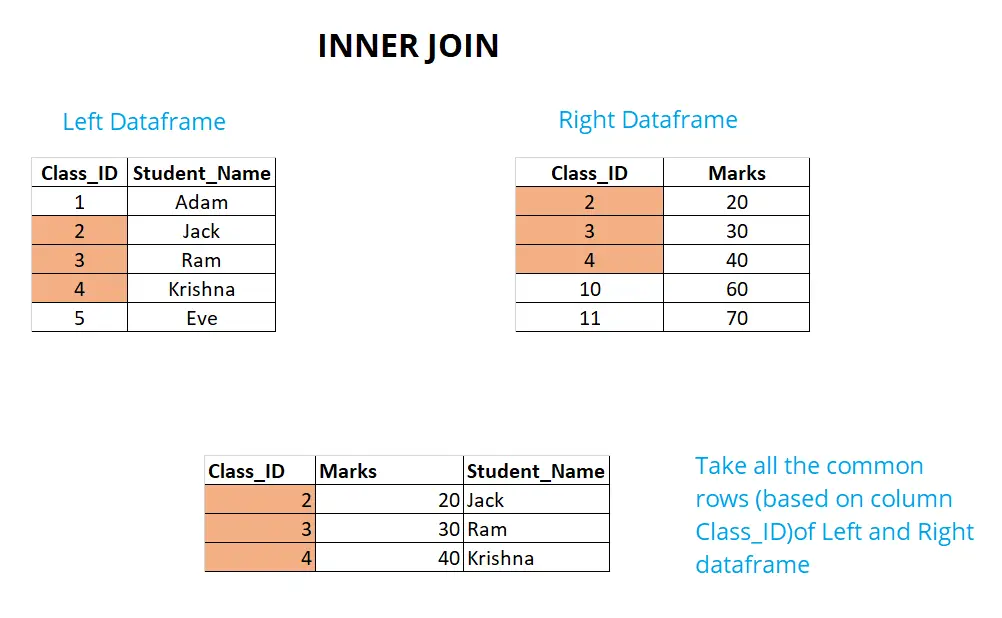
Inner Merge (Default)
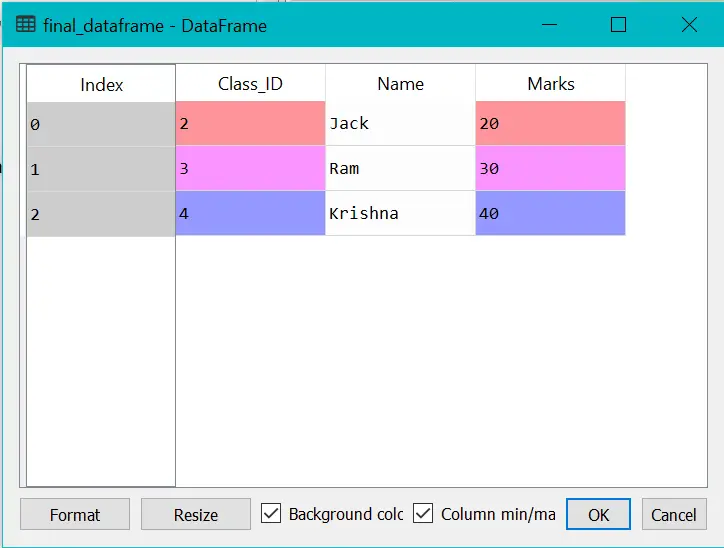
If we don't specify how parameter the panda's default will use inner merge, which will only consider the common records of both data frames based on the "on" parameter. Please see the image below:
Example:
    import pandas as pd
    import numpy as np

    dataframe1 = pd.DataFrame({"Class_ID":[1,2,3,4],
                               "Name":["Adam","Jack","Ram","Krishna"]})

    dataframe2 = pd.DataFrame({"Class_ID":[2,3,4,10,11],
                               "Marks":[20,30,40,60,70]})


    final_dataframe = pd.merge(dataframe1,dataframe2,on="Class_ID")
    final_dataframe
Writing data to Files
Whether you are doing any data science project or participating in a Kaggle competition, the writing of the data to the files is extremely important. There are plenty of options available in pandas for writing files to different extensions CSV, Excel, JSON, etc. Just write dataframe.to_csv for CSV to_excel for excel, etc.
Example for writing data to a JSON Format
    import pandas as pd
    import numpy as np

    dataframe1 = pd.DataFrame({"Class_ID":[1,2,3,4],
                               "Name":["Adam","Jack","Ram","Krishna"]})

    dataframe2 = pd.DataFrame({"Class_ID":[2,3,4,10,11],
                               "Marks":[20,30,40,60,70]})


    final_dataframe = pd.merge(dataframe1,dataframe2,on="Class_ID")
    final_dataframe.to_json('finalresult.json')

Becoming Pandas Master from here:
Congrats! You have covered the pandas tutorial and now you have an in-depth understanding of it. But this is not the end, mastering pandas involves immense hands-on. Since you are ready for the hands-on session.
Please find the below link of hands-on practicing pandas for machine learning
Pandas Hands-on Exercise - Kaggle
If you have any queries or suggestions. Please drop a comment below. I Will be happy to help you :).
Leave a Comment

Popular Posts

